Cash vs GICs vs Bonds

February 26, 2024

So far this year, investors have piled into cash, added into bonds and sucked money out of equities. Apologies, we are going to use U.S. listed data here for convenience and because larger numbers are more fun. Based on ICI data, investors have sucked $25B out of equities, added $122 billion to cash and added $52 billion to bonds. The chart below is the rolling 4-week average flows into bonds and equities. Equities have remained sporadic over the past few years, with brief periods of inflows and outflows. In 2023, a solid year in the market, equity outflows were $133 billion, so the trend in 2024 remains much the same. Bonds, which experienced HUGE outflows in 2022 as yields rose, have been seeing more inflows of late.

While equity flows have been negative on aggregate, it does appear it is largely broad-based U.S. exposure that is being reduced. International is up a little, and if ETF flows are any indication, technology is attracting some flows. But we are going to pivot to cash and bonds. It shouldn’t be too surprising that the inflows to cash and bonds, with the most attractive yields in many years, are a strong lure.
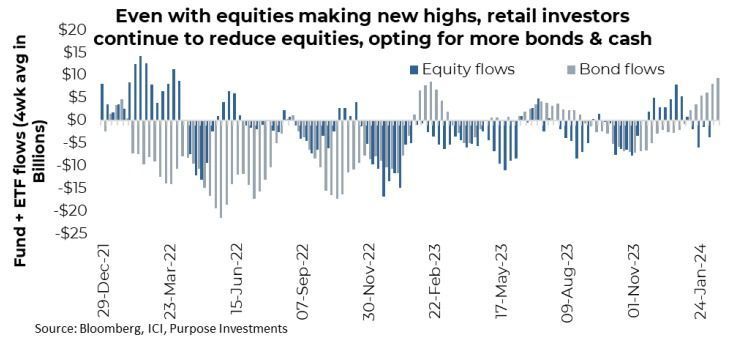
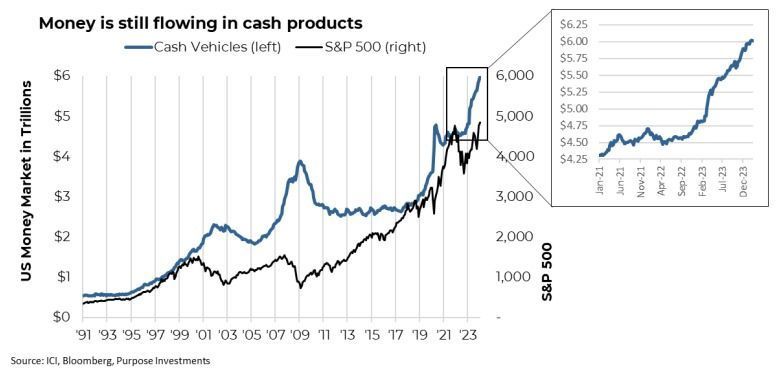
The flows into cash vehicles have been incredible. Even more incredible is that cash inflows have historically coincided with periods of market weakness (see 2001, 2008, and 2020 in the chart below). Yet these current inflows are more about capital being attracted by a decent yield as opposed to capital fleeing equity markets and looking for a place to hide. More of a pull compared to a push. It is also important to differentiate where the dollars are coming from. If simply moving from a bank account that pays very little to a higher yield vehicle, it is possible that money will never move into more risk assets such as stocks or bonds. But some will, and that is one pile of cash sitting there.

Higher yields everywhere, from cash to GICs, to bonds, and even to dividend-paying equities, have created perhaps one of the most recurring questions of the past year – which is best between cash, GICs and bonds? We will tackle the dividend equities in another instalment.

Cash, GICs or Bonds?


It is not a simple question as much depends on the purpose of the capital and what happens next in these markets. For simplicity, we are going to reference High-Interest Savings Accounts for cash, and we pulled a preferred GIC offering as our proxy for GICs. Naturally, these are just estimates or approximations.


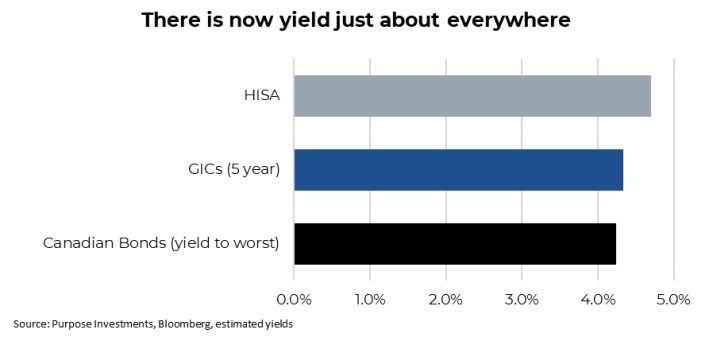
 The really interesting aspect today is how similar yields have become across the three options. HISAs, even after the changing legislations (an update on that HERE ), are carrying a yield between 4.5 and 5%. GICs are a bit lower, at just above the 4% level. And Bonds, which do carry lower current yields in the 3-3.5%, have a baked-in gain given most are trading at a discount to par, which brings the yield to worst up to around 4.2%. So, really, they are all kind of clustered together, offering some decent yields. 

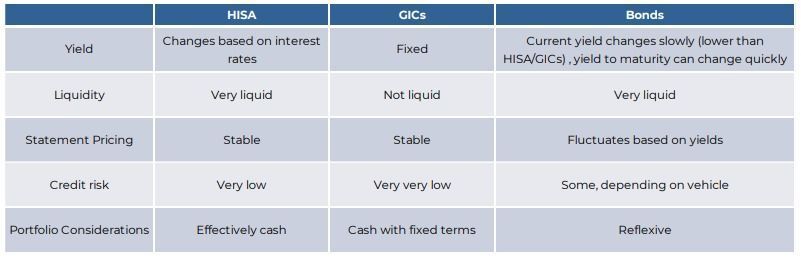
Each of the three options do offer rather different characteristics that will behave differently depending on what markets and rates do in the coming quarters or years. The table below really tries to capture some of the more pertinent characteristics of each.

It really depends on what happens next. Here are three simplistic scenarios, with who wins or loses among HISA vs GICs vs Bonds.
#1 Inflation remains sticky
While not our base case expectation, what if inflation remains sticky or even accelerates? We have just seen U.S. CPI tick higher over the past few months. In this case, central banks are unlikely to start cutting rates anytime soon and could even raise rates. This would also likely translate into bond yields moving higher.
  • HISA wins as yields remain high, and any potential rate hikes would result in more yield with a stable value.
  • GICs do ok, given the high rate is locked in and while they would not capture any rate hikes the quoted price of the GIC would remain stable even if yields rose.
  • Bonds lose as higher inflation and yields result in lower bond prices.

#2 Goldilocks
Inflation continues its path down, allowing bank rates to come down a little. However, with a still resilient economy, central banks won’t be overly aggressive in cutting rates. All three options do ok under this scenario.
  • GICs win, given the coupon rate is locked in at what is now a higher level than the overall market.
  • HISAs do ok. The bank rate cuts result in a lower yield, but since there are only a few, the yield remains healthy.
  • Bonds do ok. Lower inflation and bank rates likely translate into bond yields coming down a bit, adding some capital appreciation to the current yield.

#3 Slow growth or recession
Inflation fades as the global economy continues to decelerate; this results in more aggressive central bank rate cuts. The recession also leads to a material fall in bond yields.
  • Bonds win as lower yields lead to healthy capital appreciation. There could be some credit risk, though, depending on the type of bonds held.
  • GICs do ok, enjoying the locked in yield. But in this case, the stable pricing of GICs is a weakness as their price would rise given lower bond yields.
  • HISA lags as the current yield comes down as central banks cut rates more aggressively. 

These are very simple scenarios but clearly demonstrate some of the pros and cons of each option. Yet there are some even more important considerations. If the capital is just looking for a higher rate from, say, a chequing account, just lock in with GICs or go variable with a HISA. However, if the capital is part of an overall portfolio, it’s a bit more complicated.
Bonds tend to do well when the market goes risk-off (aka equities lower) – This is the reflexive nature of bonds & equities. While it doesn’t always work, like in 2022, it does work most of the time. Bonds provide a ballast for the portfolio and often will move in the opposite direction, especially when equities are falling. HISA and GICs offer price stability but not this reflexive behaviour.
Optionality – What if equities fall 20 or 30%? The ability to rebalance during more volatile periods in the market is a very important process that adds value over time. If too much capital is locked in, this reduces the ability to rebalance. Bonds and HISAs offer optionality.

Final Thoughts


There is no right or wrong answer to the original question; in fact, much depends on the purpose of the capital and what happens next in the market. And while that may complicate the process, at least today, there are many choices and options to find yield. A few years ago the demand for cash, GICs and even bonds was far less than today. It's nice to have choices.

— Craig Basinger is the Chief Market Strategist at Purpose Investments


Source: Charts are sourced to Bloomberg L.P. and Purpose Investments Inc.


The contents of this publication were researched, written and produced by Purpose Investments Inc. and are used by Echelon Wealth Partners Inc. for information purposes only.


This report is authored by Craig Basinger, Chief Market Strategist, Purpose Investments Inc.


Disclaimers
Echelon Wealth Partners Inc. 
The opinions expressed in this report are the opinions of the author and readers should not assume they reflect the opinions or recommendations of Echelon Wealth Partners Inc. or its affiliates. Assumptions, opinions and estimates constitute the author's judgment as of the date of this material and are subject to change without notice. We do not warrant the completeness or accuracy of this material, and it should not be relied upon as such. Before acting on any recommendation, you should consider whether it is suitable for your particular circumstances and, if necessary, seek professional advice. Past performance is not indicative of future results. The comments contained herein are general in nature and are not intended to be, nor should be construed to be, legal or tax advice to any particular individual. Accordingly, individuals should consult their own legal or tax advisors for advice with respect to the tax consequences to them.
Purpose Investments Inc. 
Purpose Investments Inc. is a registered securities entity. Commissions, trailing commissions, management fees and expenses all may be associated with investment funds. Please read the prospectus before investing. If the securities are purchased or sold on a stock exchange, you may pay more or receive less than the current net asset value. Investment funds are not guaranteed, their values change frequently and past performance may not be repeated. 
Forward Looking Statements
Forward-looking statements are based on current expectations, estimates, forecasts and projections based on beliefs and assumptions made by author. These statements involve risks and uncertainties and are not guarantees of future performance or results and no assurance can be given that these estimates and expectations will prove to have been correct, and actual outcomes and results may differ materially from what is expressed, implied or projected in such forward-looking statements. Assumptions, opinions and estimates constitute the author’s judgment as of the date of this material and are subject to change without notice. Neither Purpose Investments nor Echelon Partners warrant the completeness or accuracy of this material, and it should not be relied upon as such. Before acting on any recommendation, you should consider whether it is suitable for your particular circumstances and, if necessary, seek professional advice. Past performance is not indicative of future results. These estimates and expectations involve risks and uncertainties and are not guarantees of future performance or results and no assurance can be given that these estimates and expectations will prove to have been correct, and actual outcomes and results may differ materially from what is expressed, implied or projected in such forward-looking statements. Unless required by applicable law, it is not undertaken, and specifically disclaimed, that there is any intention or obligation to  update or revise the forward-looking statements, whether as a result of new information, future events or otherwise. Before acting on any recommendation, you should consider whether it is suitable for your particular circumstances and, if necessary, seek professional advice. 
The particulars contained herein were obtained from sources which we believe are reliable, but are not guaranteed by us and may be incomplete. This is not an official publication or research report of either Echelon Partners or Purpose Investments, and this is not to be used as a solicitation in any jurisdiction. 
This document is not for public distribution, is for informational purposes only, and is not being delivered to you in the context of an offering of any securities, nor is it a recommendation or solicitation to buy, hold or sell any security.

Share this post

By Website Editor June 17, 2024
It seems like just yesterday that you could buy a pint of Stella for $7 or so. Now, more often than not, it is closer to $10. Yep, inflation. It is kind of like a tax on doing things, as just about everything has cost more over the past few years. Hop on a flight, eat at a nice restaurant, refinance your mortgage, the list goes on. With the benefit of hindsight, the current higher inflationary environment can be blamed on a few pretty big factors. Changes in behaviour during and coming out of the pandemic blew up supply changes, as capacity was unable to keep pace with demand. Then, of course, unprecedented money printing magnified the situation, as it made everyone wealthier and more willing to pay $10 for a pint. Of course, the textbook solution is to raise interest rates, which is clearly occurring around the world. These monetary policy shifts are effective but do work with variable lags. Making those lags longer, or even temporally offsetting them, was fiscal policy. It doesn’t take an economist to understand if the monetary policy is trying to slow the economy to tame inflation; materially elevated fiscal spending in an economy that is still growing at a decent pace is counterproductive for the inflation fight.
By Website Editor June 10, 2024
If the wealth advice service were in the manufacturing industry, the portfolio would be akin to what we make. Sure, there are many value-added services in addition to the portfolio, but it’s the portfolio that has to succeed for the client to reach their long-term goals. So, the more we can think about portfolio construction, the better. One challenge is that while portfolio construction is often based on as long a historical time period as possible, things never remain static. Markets evolve and change over time, relationships change, and the available tools in the portfolio construction toolbox also change over time. One recent change that has been a challenge is the bond/stock correlation. After a couple of decades of very low or even negative correlations between these two core building blocks, correlations are back to being positive. The following chart shows the 2-year monthly correlation between Canadian equities and bonds. It looks rather similar for the U.S. and global markets, but we just thought some Canadian content would be nice. The higher correlation means that, more often, equities and bonds are moving in the same direction. Nobody complains when both are moving higher, like in the past 12 months, but when they move lower together, everyone starts getting grumpy, like in 2022. The 2nd line, beta, measures not just the direction of the two asset classes but the magnitude of the relative move.
By Website Editor June 3, 2024
The US market is up a little over 10% this year, Canada +6%, Europe +10%, and Japan +15%, while bonds are down about -1%. Huh, that sure does look like asset allocation is working well again after the car crash of 2022. Even better news is that the market is moving higher thanks to good fundamental news, not simply because central bankers are jamming more money into the financial system. Recession risk has continued to fade, as evidenced by the survey of economists. For the UK, Canada, US, Eurozone, China & Japan, the average probability of a recession hit a high in late 2022 at about 60% and has fallen down to a mere 25% of late. The UK, which was as high as 90% and suffered two negative quarters of GDP growth, is now down to 30%, winning the most improved ribbon. Even Canada, which is clearly struggling with higher rates, has improved from over 60% to 30%. Most are clustered around the 30% zone.
By Website Editor May 28, 2024
Should it be any surprise how calm markets have become? Global equities are up 9.2% year to date. Apart from a 2% decline in January and a 5% drop in April, the trend has been steadily up to the right on the chart. We can easily slap a financial narrative on this, such as improving economic growth globally, a decent Q1 earnings season, or maybe it's just the AI frenzy. More than a third of the advances in global equities are attributed to Nvidia, Microsoft, Amazon, Meta, and Alphabet. Whatever the cause, equity volatility has been very calm so far in 2024. But it is more than this, as it isn’t just equities.  The volatility in the bond market has gone super low (2nd panel in chart). The MOVE index measures volatility in U.S. Treasury Bonds [actually at-the-money options on interest rate swaps, but let’s not go down that rabbit hole]. Even though bond yields moved higher this year, the 10-year started at 4%, gradually up to 4.75%, then back down to 4.5%; these moves pale in comparison to the last couple of years. In case you forgot, the same bond in 2022 went from 1.5% to 4.0% and in 2023, yields oscillated between 3.5 to 5.0%. Looking beyond Treasuries, credit spreads are back down to or close to historical lows. Investment Grade spreads in the U.S. are 50bps. Lows in past mini-credit cycles have been 40-60bps.
By Website Editor May 21, 2024
I think we might be in that very unique market mood when bad news is good news. The equity market weakness in April can probably be attributed to bond yields moving higher, so any economic data on the weaker growth side is welcome news at the moment. The S&P started to recover on May 3rd, rising 1.3% when the ever-important non-farm payroll labour report came in softer than expected, helping 10-year yields fall back down to 4.5%. Then, over the past few weeks, we have seen generally weaker economic data for the ever-important U.S. economy; bond yields have continued to come down, and equity prices have moved up. Of course, all eyes were on the U.S. inflation print for April, which was marginally softer than expected (soft CPI is truly good news), helping bond yields fall and pushing the S&P 500 to a new all-time high. But really, 0.3% vs. expectations of 0.4% is not huge, especially given that the core reading was in line at 0.3%. This still has the annualized 3-month change running a hot 4.5%. To be fair, there was some good news beneath the surface on the CPI print. But on that day, helping, and less talked about, was a really weak Empire manufacturing survey and weak retail sales.
By Website Editor May 13, 2024
The normal narrative for encouraging investors to look at emerging markets typically goes like this: The valuations are cheap, the demographics/rising incomes are supportive of growth, and they offer diversification. Perhaps this is more the marketing narrative. Kind of how, like for infrastructure strategies, they always talk about how many bridges need repairing. We are not refuting any of the above reasons, as they have been rather perennial for many, many years. And yet, for those who know us, we have been rather negative or at least cool on emerging markets for a long time. How long? Well, this negative view persisted for well over a decade. This is us giving ourselves a pat on the back since Emerging Markets (EM) have done roughly nothing for the past 12 years as Developed Markets (DM) have charged higher (chart).
By Website Editor May 6, 2024
Take your pick. There is no shortage of both good and bad news floating about the financial markets. To be fair, this is always the case. The hard part is understanding which side is stronger today and which side will be stronger tomorrow. With markets up low to mid-single digits following a very strong Q4 finish to 2023, most would agree the optimists are carrying the day at the moment. It is not just rose-coloured glasses; there is good news out there. Economic growth signs or momentum appear to be improving year-to-date. Dial back a few quarters, and the U.S. economy remained resilient while other economies softened or were rather lacklustre, including Canada, Europe, Japan, and China, to highlight some of the biggies. Today, while Canada is struggling, momentum in the U.S. has moved even higher, and there are signs of improvement in most jurisdictions.
By Website Editor April 29, 2024
There are three things you should rarely ever bet against: the Leaf’s opposing team in the playoffs, the American consumer’s ability to spend, and corporate profits. As we are now about halfway through U.S. earnings season, once again, positive surprises remain the norm; 81% have beaten. It's a bit better than the 20-year average of 75%. The fact is that companies are good at managing analysts’ expectations. At least enough to beat them when the numbers hit the tape. The size of the positive surprises have been encouraging as well, at just under 10%. The highest surprise magnitude in some time.  One of our reservations on the sustainability of this market rally over the past couple of quarters has been the flat earnings revisions. In other words, global markets are up over 20% but earnings estimates have remained flat or tilted down slightly. More often than not, markets trend in the same direction as earnings revisions. Earnings get revised up when companies raise guidance and/or analysts become more encouraged about growth prospects. That is a good thing for markets. Obviously, downward revisions are bad. Yet estimates have remained very flat as markets marched higher, a challenging combination.
By Website Editor April 22, 2024
The oil market has been interesting lately and, to the surprise of many, has been the biggest silent outperformer this year. There is no shortage of geopolitical events to choose from that’s leading to a higher risk premium in oil with Brent breaking $90, whether it’s the Houthis missile attacks in the Red Sea leading to a massive re-route of trade, Ukraine’s drone strikes on Russian refineries, and the latest escalation between Israel and Iran leading to some news outlets using WWIII as click bait-y headlines. Given the run-up in oil prices, Canadian oil equities have clearly benefitted from the much higher torque. But there is a layer of even better news: The Transmountain Expansion (TMX) continues to look to be in operation by May, which would lead to much better pricing on the Western Canadian Select (WCS). With the current setup for the oil markets, some key questions that we often get from investors are: How sustainable is the rally in Canadian energy names? To determine if the oil equities are overstretched, we can look at the debt-adjusted cash flow (DACF) multiples of the major integrated oil names and see how the valuation has shifted in light of the recent oil move. From Exhibit 1, the DACF multiples for the Canadian integrated have been fairly range-bound over the last year, also in line with WTI, which has been in the $70 - $85 range. As a starting point, we can infer that the valuations of the companies have been commensurate with the movements in the underlying oil price deck and in line with where the equities should trade in the cycle historically over the last couple of years. Typically, in the commodities cycle, higher prices are usually coupled with lower multiples as market participants will usually price in lower normalized prices and vice versa, so a cause of concern would be if valuation starts trending towards the 6.5x – 7.0x+ area if oil prices continue to stay in the upper bounds of the $70 - $90 range or higher.
By Website Editor April 17, 2024
As part of your wealth planning, have you considered your wealth’s longevity? Many of us have heard of the “shirtsleeves curse”: Family wealth is often built up and lost within three generations. You may not be surprised to learn that recipients often make “big” purchases within the first few weeks of receiving their inheritance. This is because many heirs are not focused on the longevity of new-found wealth. What are high-net-worth families doing to help prevent this loss? There has been an increasing focus on intergenerational wealth planning, with the objective of supporting wealth longevity. This involves getting existing generations to meet about their finances and form shared financial goals and values to help encourage lasting wealth. Here are some steps that can be taken as part of this planning process: Start with a plan and document it Start by thinking about your vision for your wealth for the generations to come. The plan should set out goals and provisions for how you wish funds to be used, accessed and replenished. For instance, you may wish for family members to invest in themselves to gain the experience needed to create and grow wealth, using funds for higher education or a business start-up or expansion. Others may wish to leave endowments to a charity. Once you determine your goals and provisions, it is important to formally record them as this document will be passed along to future generations. Communicate your plan Once the plan has been documented, it should be communicated to family members. Often, parents keep their finances and related values to themselves, missing the opportunity to pass along their ideals to children. While specific financial details need not be disclosed, sharing your vision is intended to be a catalyst for meaningful discussions. Some families use this plan to form a family constitution to help future generations carry forward their intentions. Engage in regular meetings Regular family meetings are intended to help cultivate family values based on your vision for your wealth. If wealth has been carefully built up through the generations, it may involve exploring family history. Or, you may use this time to educate children about finances and managing money or introduce high-level strategies to carry out the intergenerational plan relating to running a family business or a family giving strategy. Consider protection tools You may determine through family meetings that beneficiaries will need support. Certain tools can support beneficiaries to meet your goals, or protect future wealth in situations in which beneficiaries may not be capable. For example, a trust can put assets under the control of a responsible trustee, with the terms of the trust specifying the conditions, timing and amount of distributions to be made to heirs. Other tools, such as life insurance, can protect and grow assets while also providing access to cash. Setting up a support system of trusted professionals may help to ensure a successful wealth transfer, especially if heirs do not have the skills to manage funds independently. Monitor the plan’s success By having an ongoing dialogue with family members, you will be able to identify and address any gaps or concerns as they arise. You can also continue to define and refine family roles to ensure that your plan has a greater chance of success. Here to Provide Support While intergenerational wealth planning may not be for everyone, consider that creating a lasting legacy can be one of the greatest gifts you leave behind. If you need assistance with family discussions or educational tools to support children, please contact your Echelon Advisor.
More Posts